How to use the Dashboard
The DiversiPro IDEA Dashboard™ is designed to help you effectively track, measure, and manage your organization’s inclusion, diversity, equity and anti-racism (IDEA) programs.
Combined with a tested and proven approach, the DiversiPro IDEA Dashboard™ will help you to:
- Diagnose your organization’s IDEA status
- Identify IDEA gaps and where improvements can be made
- Gauge how stakeholders experience the organization via their IDEA efforts
- Apply IDEA results to develop new processes, practices, and policies
- Design, monitor, and manage actionable and integrated IDEA programs
- Share your IDEA results and recommendations in real time with our easy-to-access and downloadable reports
Getting started
We are excited for you to begin your IDEA assessment. Let us show you how in three easy steps.
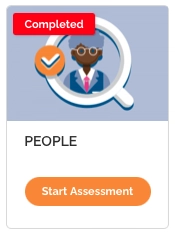
Navigate to one of the six cylinders and then press the start the assessment button.
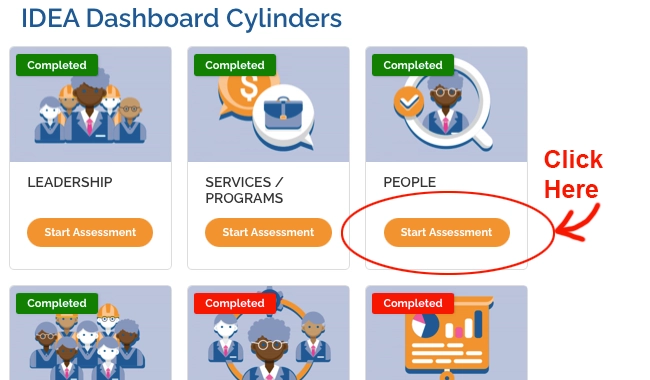
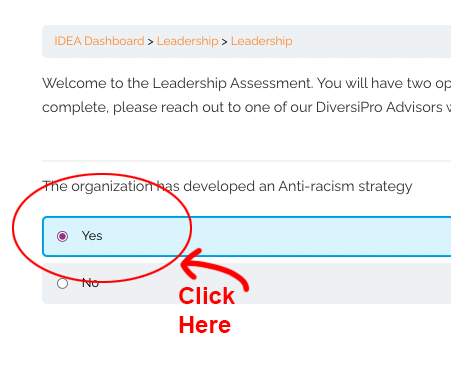
Answer all of the questions in the assessment and proceed to next cylinder until all six of them are complete.
After completing all six cylinders, scroll down to the StatCanada section. Here you will fill out the form with your company demographic percentages. Then the chart will compare your company vs the latest StatsCan data to showcase to you where your company stands vs the data.
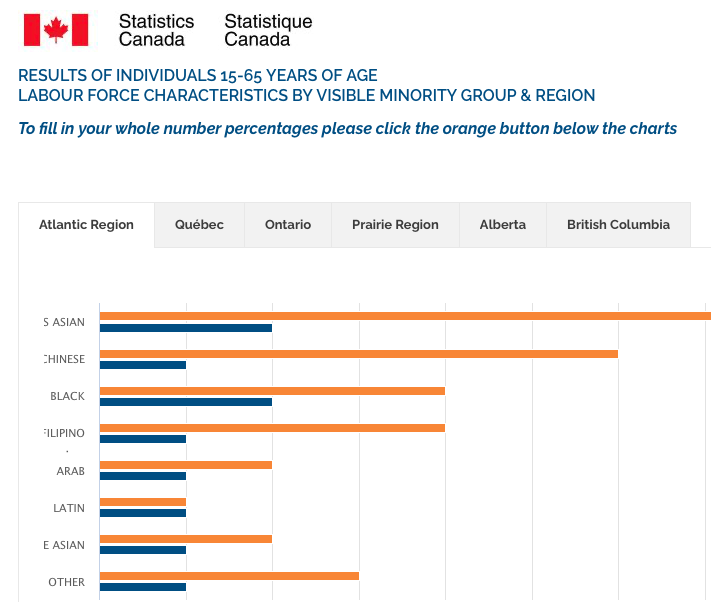
Scroll down to the orange form button and click to open the form.

Pick the province you would like to fill in. You will come back to the form to fill out each Province that is required. If you only have Ontario (for example) that is ok, just select Ontario and fill that data in. Data is in whole numbers of percentages.
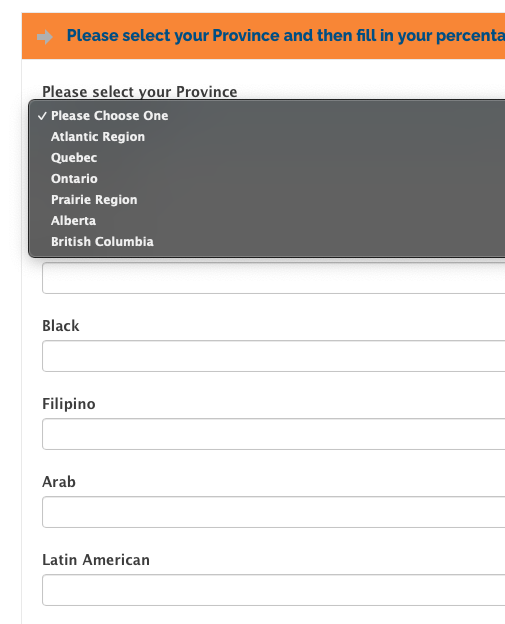
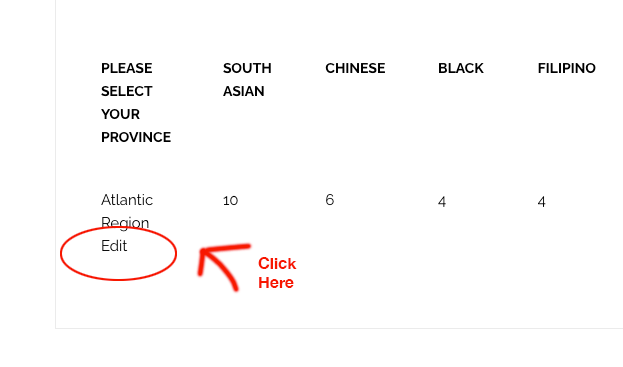
Once you have filled in your data, if you made a mistake or want to change a field, you can. All you have to do is go to the chart area and click “edit”. Once you do that, click the orange form button and your data should already be there to edit. Click “Update” when you finish.
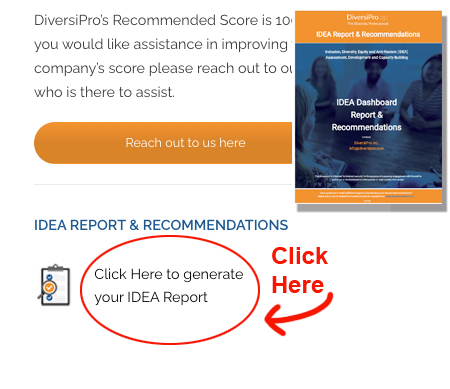
After completing all six cylinders & the StatsCan data, return to dashboard profile page and click on Your Report and Recommendations to access your report for review and analysis.
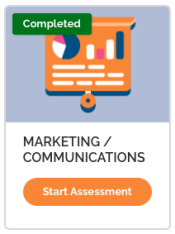
What Green Means:
Green means that you have met DiversiPro’s standards, and your assessment score falls within the acceptable range for that Cylinder.
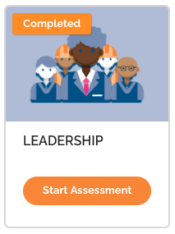
What Amber Means:
Amber means that you are on the right track, but still have some more work to do. However, your assessment score does include some of the recommendations for that Cylinder.
What Red Means:
Red means you have not met DiversiPro’s standards, and you could use some help to improve it, as your assessment score does not fall within the recommended range for that Cylinder.
We are here to help
If you have any difficulties about the DiversiPro IDEA Dashboard™, please refer to our detailed Getting Started instructions FAQs. If have you difficulties accessing or completing your assessments, or require additional support, please reach out directly to our team using the icon located in the bottom-left corner or email us here.
We look forward to helping you build and manage effective IDEA programs that last.
Sincerely,
Your DiversiPro IDEA Dashboard™ Team
